반응형
# Sin 그래프를 그리는 함수 만들어보기
import matplotlib.pyplot as plt
import numpy as np
%matplotlib inline
def plotSinWave(amp, freq, endTIme, smapleTime, startTime, bias):
  """
  plot sin wave
  y = a sin(2 pi f t + t_0) + b
  """
  time = np.arange(startTime, endTIme, smapleTime)
  result = amp * np.sin(2 * np.pi * freq * time + startTime) + bias

  plt.figure(figsize=(12, 6))
  plt.plot(time, result)
  plt.grid(True)
  plt.xlabel("time")
  plt.ylabel("sin")
  plt.title(str(amp) + "*sin(2*pi" + str(freq) + "*t+" + str(startTime) + ")+" + str(bias))
  plt.show()
  plotSinWave(1, 1, 10, 0.01, 0.5, 0)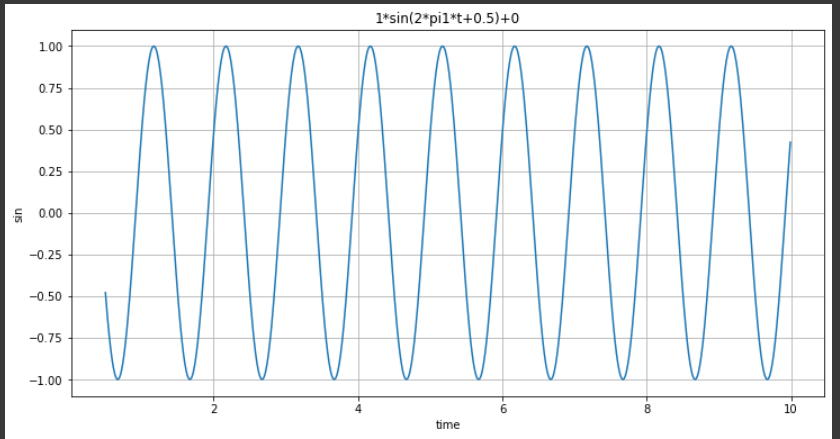
(**kwargs) keyword argument를 활용하여함수 생성
def plotSinWave(**kwargs):
  """
  plot sin wave
  y = a sin(2 pi f t + t_0) + b
  """
  amp = kwargs.get("amp",1)
  freq = kwargs.get("freq", 1)
  endTime = kwargs.get("endTIme", 1)
  smapleTime = kwargs.get("smapleTime", 0.01)
  startTime = kwargs.get("startTime", 0)
  bias = kwargs.get("bias", 0)
  figsize = kwargs.get("figsize", (12, 6))

  time = np.arange(startTime, endTime, smapleTime)
  result = amp * np.sin(2 * np.pi * freq * time + startTime) + bias

  plt.figure(figsize=(12, 6))
  plt.plot(time, result)
  plt.grid(True)
  plt.xlabel("time")
  plt.ylabel("sin")
  plt.title(str(amp) + "*sin(2*pi" + str(freq) + "*t+" + str(startTime) + ")+" + str(bias))
  plt.show()

  plotSinWave()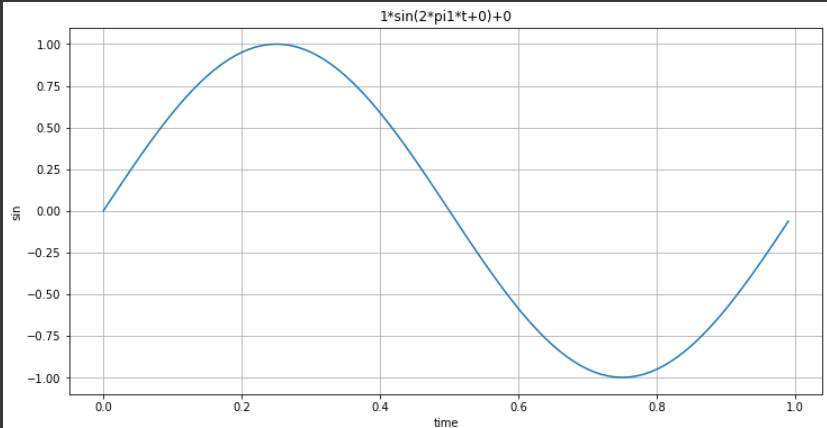
plotSinWave(amp = 2, freq = 0.5 , endTime = 10)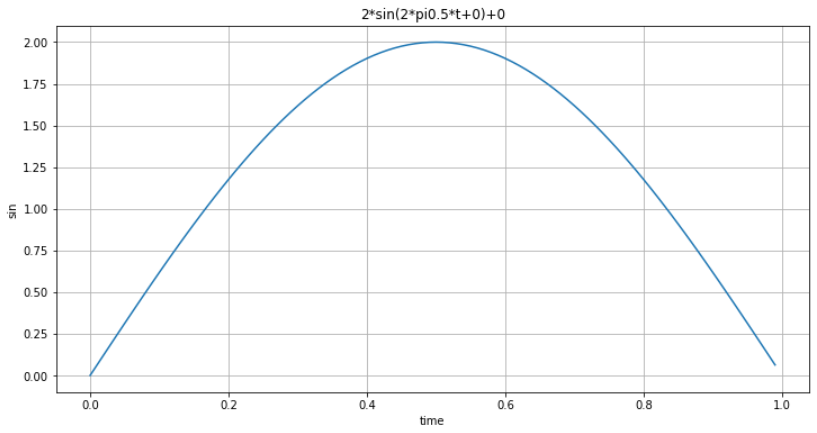
# ProPhet를 실험하기 위한 시계열 데이터 생성
time = np.linspace(0, 1, 365 * 2)
result = np.sin(2*np.pi * 12 * time)
ds = pd.date_range("2018-01-01", periods = 365 * 2, freq= "D")
df = pd.DataFrame({"ds" : ds, "y":result})
df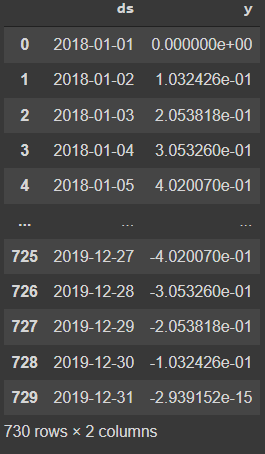
df["y"].plot(figsize=(10, 8))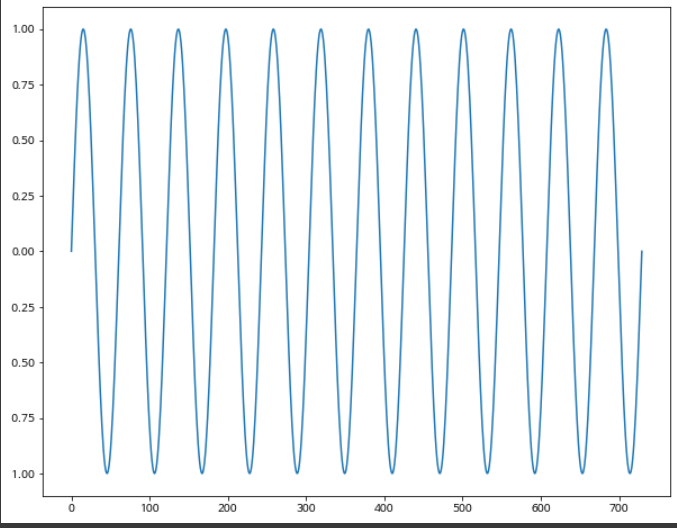
from fbprophet import Prophet
m = Prophet(yearly_seasonality= True, daily_seasonality=True)
m.fit(df)
-> fbprophet을 설치, 연계절성과 일계절성설정하여 예측해봄
future = m.make_future_dataframe(periods=30)
forecast = m.predict(future)

m.plot(forecast)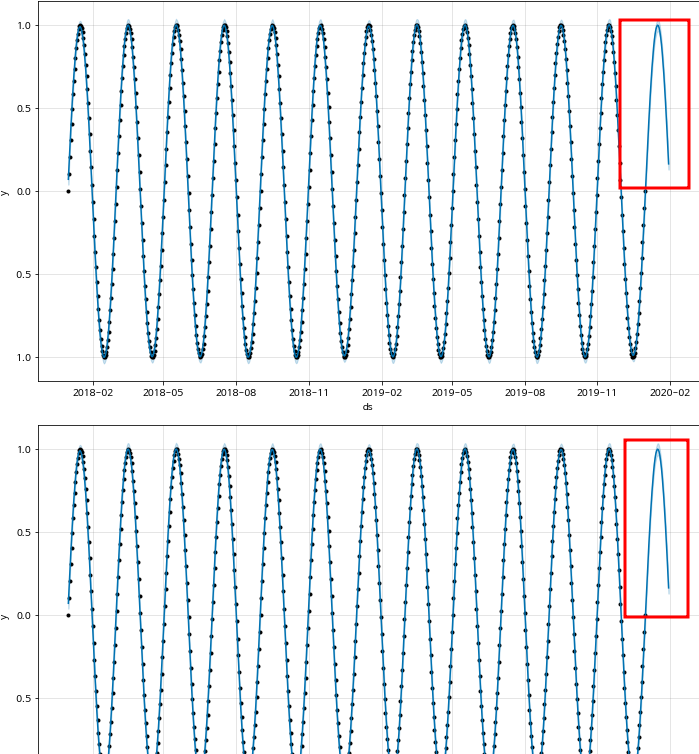
예측데이터가 생성되었다.
# 시간별로 증가 추세를 보이는 데이터를 생성
time = np.linspace(0, 1, 365 * 2)
result = np.sin(2*np.pi * 12 * time) + time
ds = pd.date_range("2018-01-01", periods=365 * 2, freq="D")

df = pd.DataFrame({"ds" : ds, "y": result})
df["y"].plot(figsize=(10, 6))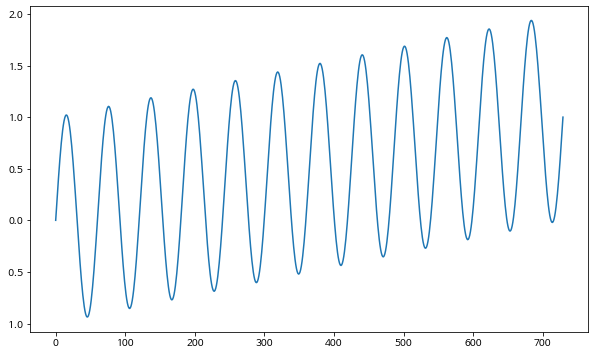
m = Prophet(yearly_seasonality=True, daily_seasonality=True)
m.fit(df)
future = m.make_future_dataframe(periods=30)
forecast = m.predict(future)
m.plot(forecast)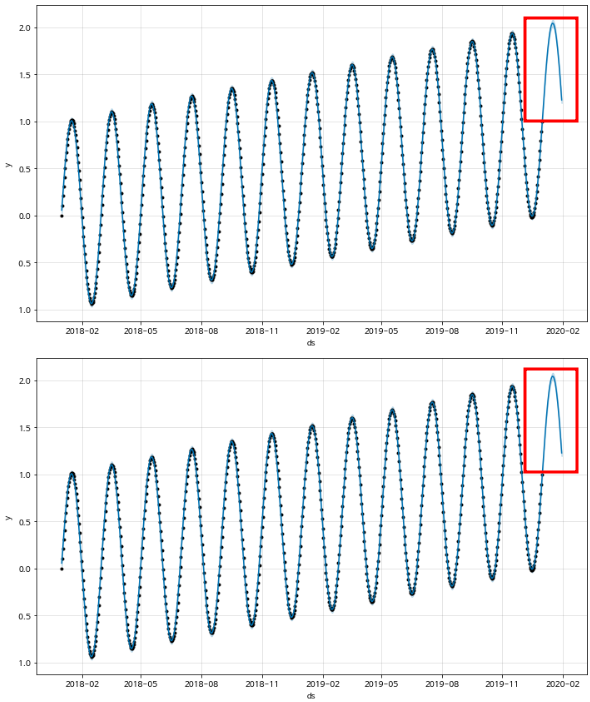
# 잡읍이 들어가는 데이터를 생성
time = np.linspace(0, 1, 365 * 2)
result = np.sin(2*np.pi * 12 * time) + time + np.random.randn(365*2) /4
ds = pd.date_range("2018-01-01", periods=365 * 2, freq="D")

df = pd.DataFrame({"ds" : ds, "y": result})
df["y"].plot(figsize=(10, 6))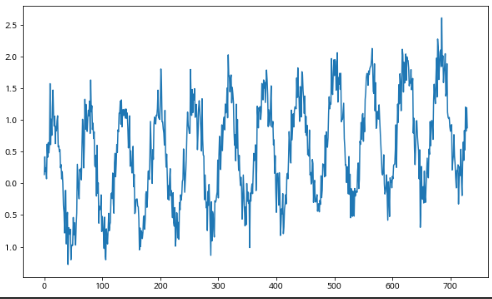
m = Prophet(yearly_seasonality=True, daily_seasonality=True)
m.fit(df)
future = m.make_future_dataframe(periods=30)
forecast = m.predict(future)
m.plot(forecast)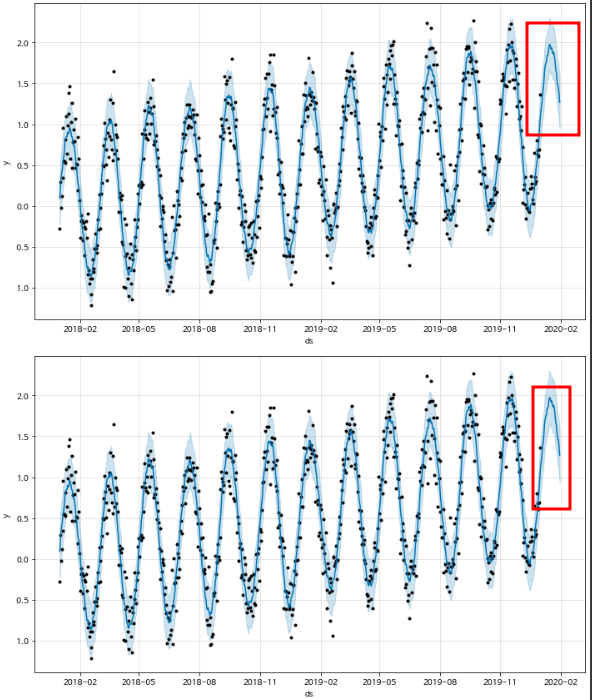
-> 잡음이 있는데이터도 잘 생성이 된다.
'파이썬 이것저것 > 파이썬 데이터분석' 카테고리의 다른 글
| [파이썬] 주유소 데이터 분석 (0) | 2022.06.05 |
|---|---|
| [파이썬] 서울범죄율 데이터 분석 (0) | 2022.06.05 |
| [파이썬] 서울 CCTV 데이터 분석해보기 (0) | 2022.06.04 |
| [파이썬] ProPhet을 활용하여 삼성전자 주식 데이터 예측해보기 (0) | 2022.04.23 |
| [파이썬] 수치형 변수의 요약, 기술통계 (0) | 2022.04.23 |