반응형
Naver Movie Ranking
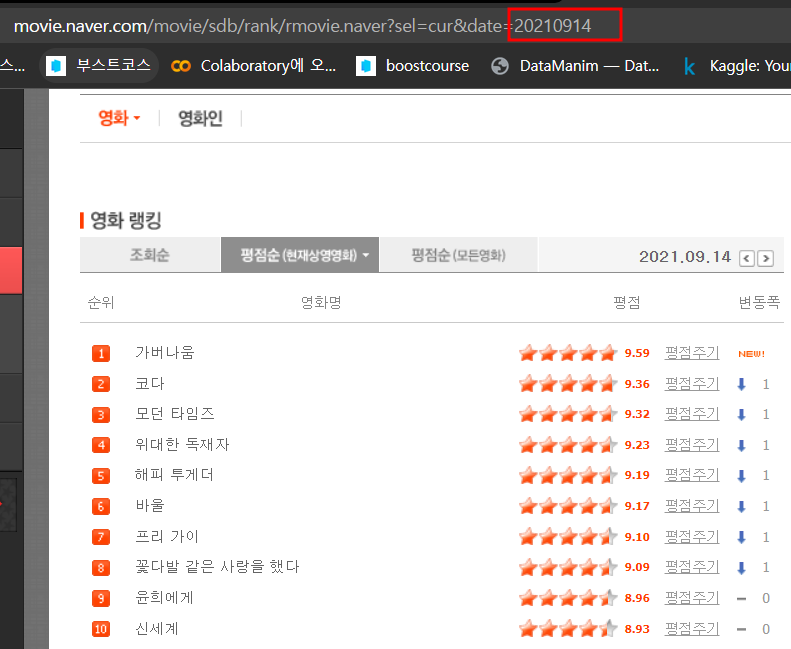
1. 네이버 영화 평점 사이트 분석
- https://movie.naver.com/
- 영화랭킹 탭 이동
- 영화랭킹에서 평점순(현재상영영화) 선택
https://movie.naver.com/movie/sdb/rank/rmovie.naver?sel=cur&date=20210914- 웹 페이지 주소에는 많은 정보가 담겨있습니다.
- 원하는 정보를 얻기 위해서 변화시켜줘야 하는 주소의 규칙을 찾을 수 있습니다.
- 여기에서는 날짜 정보를 변경해주면 해당 페이지에 접근이 가능합니다.
# requirements

import pandas as pd
from urllib.request import urlopen
from bs4 import BeautifulSoup
In [3]:
url = "https://movie.naver.com/movie/sdb/rank/rmovie.naver?sel=cur&date=20210914"
response = urlopen(url)
# response.status
soup = BeautifulSoup(response, "html.parser")
print(soup.prettify())
# 1
soup.find_all("div", "tit5")[0].a.string
Out[9]:
'가버나움'In [12]:
# 2
soup.select(".tit5")[0].find("a").text
Out[12]:
'가버나움'In [13]:
# 3
soup.select(".tit5")[0].select_one("a").get_text()
Out[13]:
'가버나움'len(soup.find_all("td", "point")), len(soup.find_all("div", "tit5"))
Out[17]:
(47, 47)In [20]:
soup.find_all("td", class_="point")[0].text, soup.select("td.point")[0].string
Out[20]:
('9.59', '9.59')In [22]:
# 영화제목 리스트

end = len(soup.find_all("div", "tit5"))

movie_name = []

for n in range(0, end):
    movie_name.append(
        soup.find_all("div", "tit5")[n].a.string
    )
movie_name
['가버나움',
'코다',
'모던 타임즈',
'위대한 독재자',
'해피 투게더',
'바울',
'프리 가이',
'꽃다발 같은 사랑을 했다',
'윤희에게',
'신세계',
'더 파더',
'이별의 아침에 약속의 꽃을 장식하자',
'중경삼림',
'천로역정: 천국을 찾아서',
'너의 이름은.',
'부에나 비스타 소셜 클럽',
'화양연화',
'캡틴 판타스틱',
'드림걸즈',
'분노',
'노매드랜드',
'블랙 위도우',
'아비정전',
'너의 췌장을 먹고 싶어',
'모가디슈',
'메기',
'우리의 20세기',
'이스케이프 룸 2: 노 웨이 아웃',
'릴리 슈슈의 모든 것',
'하나와 앨리스',
'너의 췌장을 먹고 싶어',
'맨 인 더 다크 2 ',
'날씨의 아이',
'죄 많은 소녀',
'소셜 네트워크',
'그린 나이트',
'독전',
'기담',
'호우시절',
'인질',
'더 수어사이드 스쿼드',
'레미니센스',
'싱크홀',
'올드',
'샹치와 텐 링즈의 전설',
'쏘아올린 불꽃, 밑에서 볼까? 옆에서 볼까?',
'귀문']# 영화평점 리스트
end = len(soup.find_all("td", "point"))
movie_point = [soup.find_all("td", "point")[n].string for n in range(0, end)]
movie_point# 전체 데이터 수 확인
len(movie_name), len(movie_point)2. 자동화를 위한 코드
https://movie.naver.com/movie/sdb/rank/rmovie.naver?sel=cur&date=20210914- 날짜만 변경하면 우리가 원하는 기간 만큼 데이터를 얻을 수 있습니다.
In [31]:
date = pd.date_range("2021.01.01", periods=100, freq="D")
date
DatetimeIndex(['2021-01-01', '2021-01-02', '2021-01-03', '2021-01-04',
'2021-01-05', '2021-01-06', '2021-01-07', '2021-01-08',
'2021-01-09', '2021-01-10', '2021-01-11', '2021-01-12',
'2021-01-13', '2021-01-14', '2021-01-15', '2021-01-16',
'2021-01-17', '2021-01-18', '2021-01-19', '2021-01-20',
'2021-01-21', '2021-01-22', '2021-01-23', '2021-01-24',
'2021-01-25', '2021-01-26', '2021-01-27', '2021-01-28',
'2021-01-29', '2021-01-30', '2021-01-31', '2021-02-01',
'2021-02-02', '2021-02-03', '2021-02-04', '2021-02-05',
'2021-02-06', '2021-02-07', '2021-02-08', '2021-02-09',
'2021-02-10', '2021-02-11', '2021-02-12', '2021-02-13',
'2021-02-14', '2021-02-15', '2021-02-16', '2021-02-17',
'2021-02-18', '2021-02-19', '2021-02-20', '2021-02-21',
'2021-02-22', '2021-02-23', '2021-02-24', '2021-02-25',
'2021-02-26', '2021-02-27', '2021-02-28', '2021-03-01',
'2021-03-02', '2021-03-03', '2021-03-04', '2021-03-05',
'2021-03-06', '2021-03-07', '2021-03-08', '2021-03-09',
'2021-03-10', '2021-03-11', '2021-03-12', '2021-03-13',
'2021-03-14', '2021-03-15', '2021-03-16', '2021-03-17',
'2021-03-18', '2021-03-19', '2021-03-20', '2021-03-21',
'2021-03-22', '2021-03-23', '2021-03-24', '2021-03-25',
'2021-03-26', '2021-03-27', '2021-03-28', '2021-03-29',
'2021-03-30', '2021-03-31', '2021-04-01', '2021-04-02',
'2021-04-03', '2021-04-04', '2021-04-05', '2021-04-06',
'2021-04-07', '2021-04-08', '2021-04-09', '2021-04-10'date[0]
Out[32]:
Timestamp('2021-01-01 00:00:00', freq='D')In [33]:
date[0].strftime("%Y-%m-%d")
Out[33]:
'2021-01-01'In [34]:
date[0].strftime("%Y.%m.%d")
Out[34]:
'2021.01.01'In [38]:
# 문자열 format

test_string = "Hi, I'm {name}"
test_string.format(name="Zerobase")
test_string.format(name="Pinkwink")
# dir(test_string)
Out[38]:
"Hi, I'm Pinkwink"In [40]:
import time
from tqdm import tqdm

movie_date = []
movie_name = []
movie_point = []

for today in tqdm(date):
    url = "https://movie.naver.com/movie/sdb/rank/rmovie.naver?sel=cur&date={date}"
    response = urlopen(url.format(date=today.strftime("%Y%m%d")))
    soup = BeautifulSoup(response, "html.parser")

    end = len(soup.find_all("td", "point"))

    movie_date.extend([today for _ in range(0, end)])
    movie_name.extend([soup.select("div.tit5")[n].find("a").get_text() for n in range(0, end)])
    movie_point.extend([soup.find_all("td", "point")[n].string for n in range(0, end)])

    time.sleep(0.5)
len(movie_date), len(movie_name), len(movie_point)
Out[41]:
(4793, 4793, 4793)In [42]:
movie_point[:5]
Out[42]:
['9.59', '9.52', '9.49', '9.40', '9.39']In [43]:
movie_name[:5]
Out[43]:
['가나의 혼인잔치: 언약', '언플랜드', '극장판 바이올렛 에버가든', '부활: 그 증거', '소년시절의 너']In [44]:
movie = pd.DataFrame({
"date": movie_date,
"name": movie_name,
"point": movie_point
})
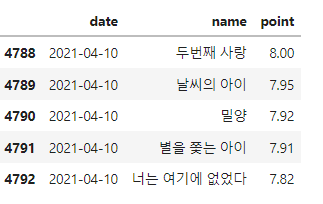
movie.tail()
movie.info()
<class 'pandas.core.frame.DataFrame'>
RangeIndex: 4793 entries, 0 to 4792
Data columns (total 3 columns):
 #   Column  Non-Null Count  Dtype
---  ------  --------------  -----
 0   date    4793 non-null   datetime64[ns]
 1   name    4793 non-null   object
 2   point   4793 non-null   object
dtypes: datetime64[ns](1), object(2)
memory usage: 112.5+ KB
In [47]:
movie["point"] = movie["point"].astype(float)
movie.info()
<class 'pandas.core.frame.DataFrame'>
RangeIndex: 4793 entries, 0 to 4792
Data columns (total 3 columns):
 #   Column  Non-Null Count  Dtype
---  ------  --------------  -----
 0   date    4793 non-null   datetime64[ns]
 1   name    4793 non-null   object
 2   point   4793 non-null   float64
dtypes: datetime64[ns](1), float64(1), object(1)
memory usage: 112.5+ KB
In [48]:
# 데이터 저장

movie.to_csv(
    "../data/03. naver_movie_data.csv", sep=",", encoding="utf-8"
)
3. 영화 평점 데이터 정리
In [75]:
import numpy as np
import pandas as pd
In [76]:
movie = pd.read_csv("../data/03. naver_movie_data.csv", index_col=0)
movie.tail()
- 영화 이름으로 인덱스를 잡습니다.
- 점수의 합산을 구합니다.
- 100일 간 네이버 영화 평점 합산 기준 베스트&워스트 10 선정
In [78]:
# pivot table

movie_unique = pd.pivot_table(data=movie, index="name", aggfunc=np.sum)
movie_unique
# pivot table
movie_unique = pd.pivot_table(data=movie, index="name", aggfunc=np.sum)
movie_unique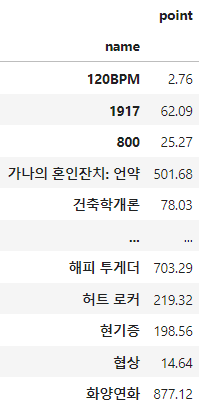
movie_best = movie_unique.sort_values(by="point", ascending=False) # 내림차순
movie_best.head()
tmp = movie.query("name == ['화양연화']")
tmp
# 시각화

import matplotlib.pyplot as plt
from matplotlib import rc

rc("font", family="Arial Unicode MS") # Windows: Malgun Gothic
%matplotlib inline
# get_ipython().run_line_magic("matplotlib", "inline")
In [87]:
plt.figure(figsize=(20, 8)) # x 20, y, 8
plt.plot(tmp["date"], tmp["point"]) # 선 그래프 x축 날짜, y축 평점 => 날짜에 따른 평점 변화를 선그래프로 표현(시계열)
plt.title("날짜별 평점")
plt.xlabel("날짜")
plt.ylabel("평점")
plt.xticks(rotation="vertical")
plt.legend(labels=["평점 추이"], loc="best")
plt.grid(True)
plt.show()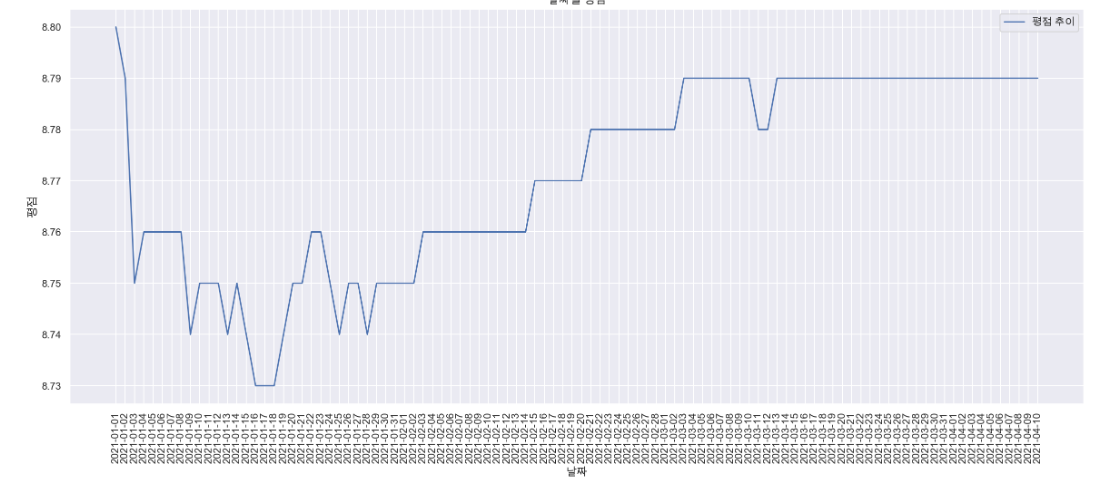
# 상위 10개 영화
movie_best.head(10)
# 하위 10개 영화
movie_best.tail(10)
movie_pivot = pd.pivot_table(data=movie, index="date", columns="name", values="point")
movie_pivot.head()
movie_pivot.to_excel("../data/03. movie_pivot.xlsx")
In [92]:
# movie_pivot.columns = movie_pivot.columns.droplevel()
In [93]:
import platform
import seaborn as sns
from matplotlib import font_manager, rc

path = "C:/Windows/Fonts/malgun.ttf"

if platform.system() == "Darwin":
    rc("font", family="Arial Unicode MS")
elif platform.system() == "Windows":
    font_name = font_manager.FontProperties(fname=path).get_name()
    rc("font", family=font_name)
else:
    print("Unknown system. sorry")
In [97]:
target_col = ["화양연화", "국가부도의 날", "하나와 앨리스", "늑대와 춤을", "피아노"]
plt.figure(figsize=(20, 8))
plt.title("날짜별 평점")
plt.xlabel("날짜")
plt.ylabel("평점")
plt.xticks(rotation="vertical")
plt.tick_params(bottom="off", labelbottom="off")
plt.plot(movie_pivot[target_col])
plt.legend(target_col, loc="best")
plt.grid(True)
plt.show()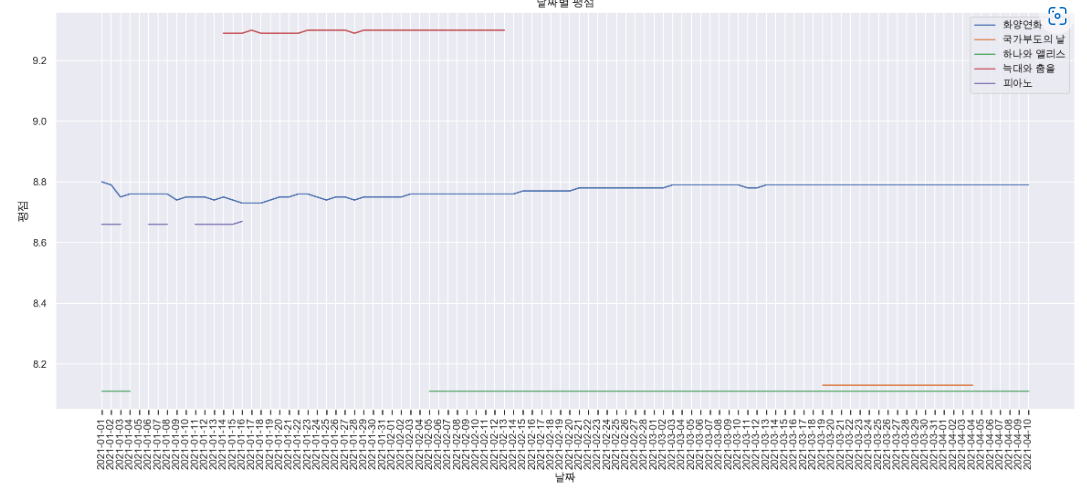
'파이썬 이것저것 > 크롤링' 카테고리의 다른 글
| [파이썬] 서울시 주유소 크롤링 (0) | 2022.06.05 |
|---|---|
| [파이썬] Naver API 등록해서 사용해보기 (0) | 2022.06.04 |
| [파이썬] 스타벅스, 이디야 매장 크롤링 및 분석 (0) | 2022.04.24 |
| [크롤링] GS25 매장 크롤링 -1 (0) | 2022.04.17 |